
Fiber carries light with low loss, yet many systems still need a precise way to vary optical power. They use intensity modulation to encode digital data, create analog waveforms, gate pulses, calibrate instruments, or apply controlled excitation in sensing.
The modulator becomes the point where an electrical command is translated into an optical-power pattern. That translation must remain accurate over frequency, temperature, optical input, and manufacturing variation. A device with adequate nominal bandwidth may still introduce loss, bias drift, or distortion that reduces receiver margin.
They therefore specify the optical waveform required at the system reference plane and work backward to the electrical drive and component limits. This backward design process keeps device selection tied to the waveform the system must deliver.
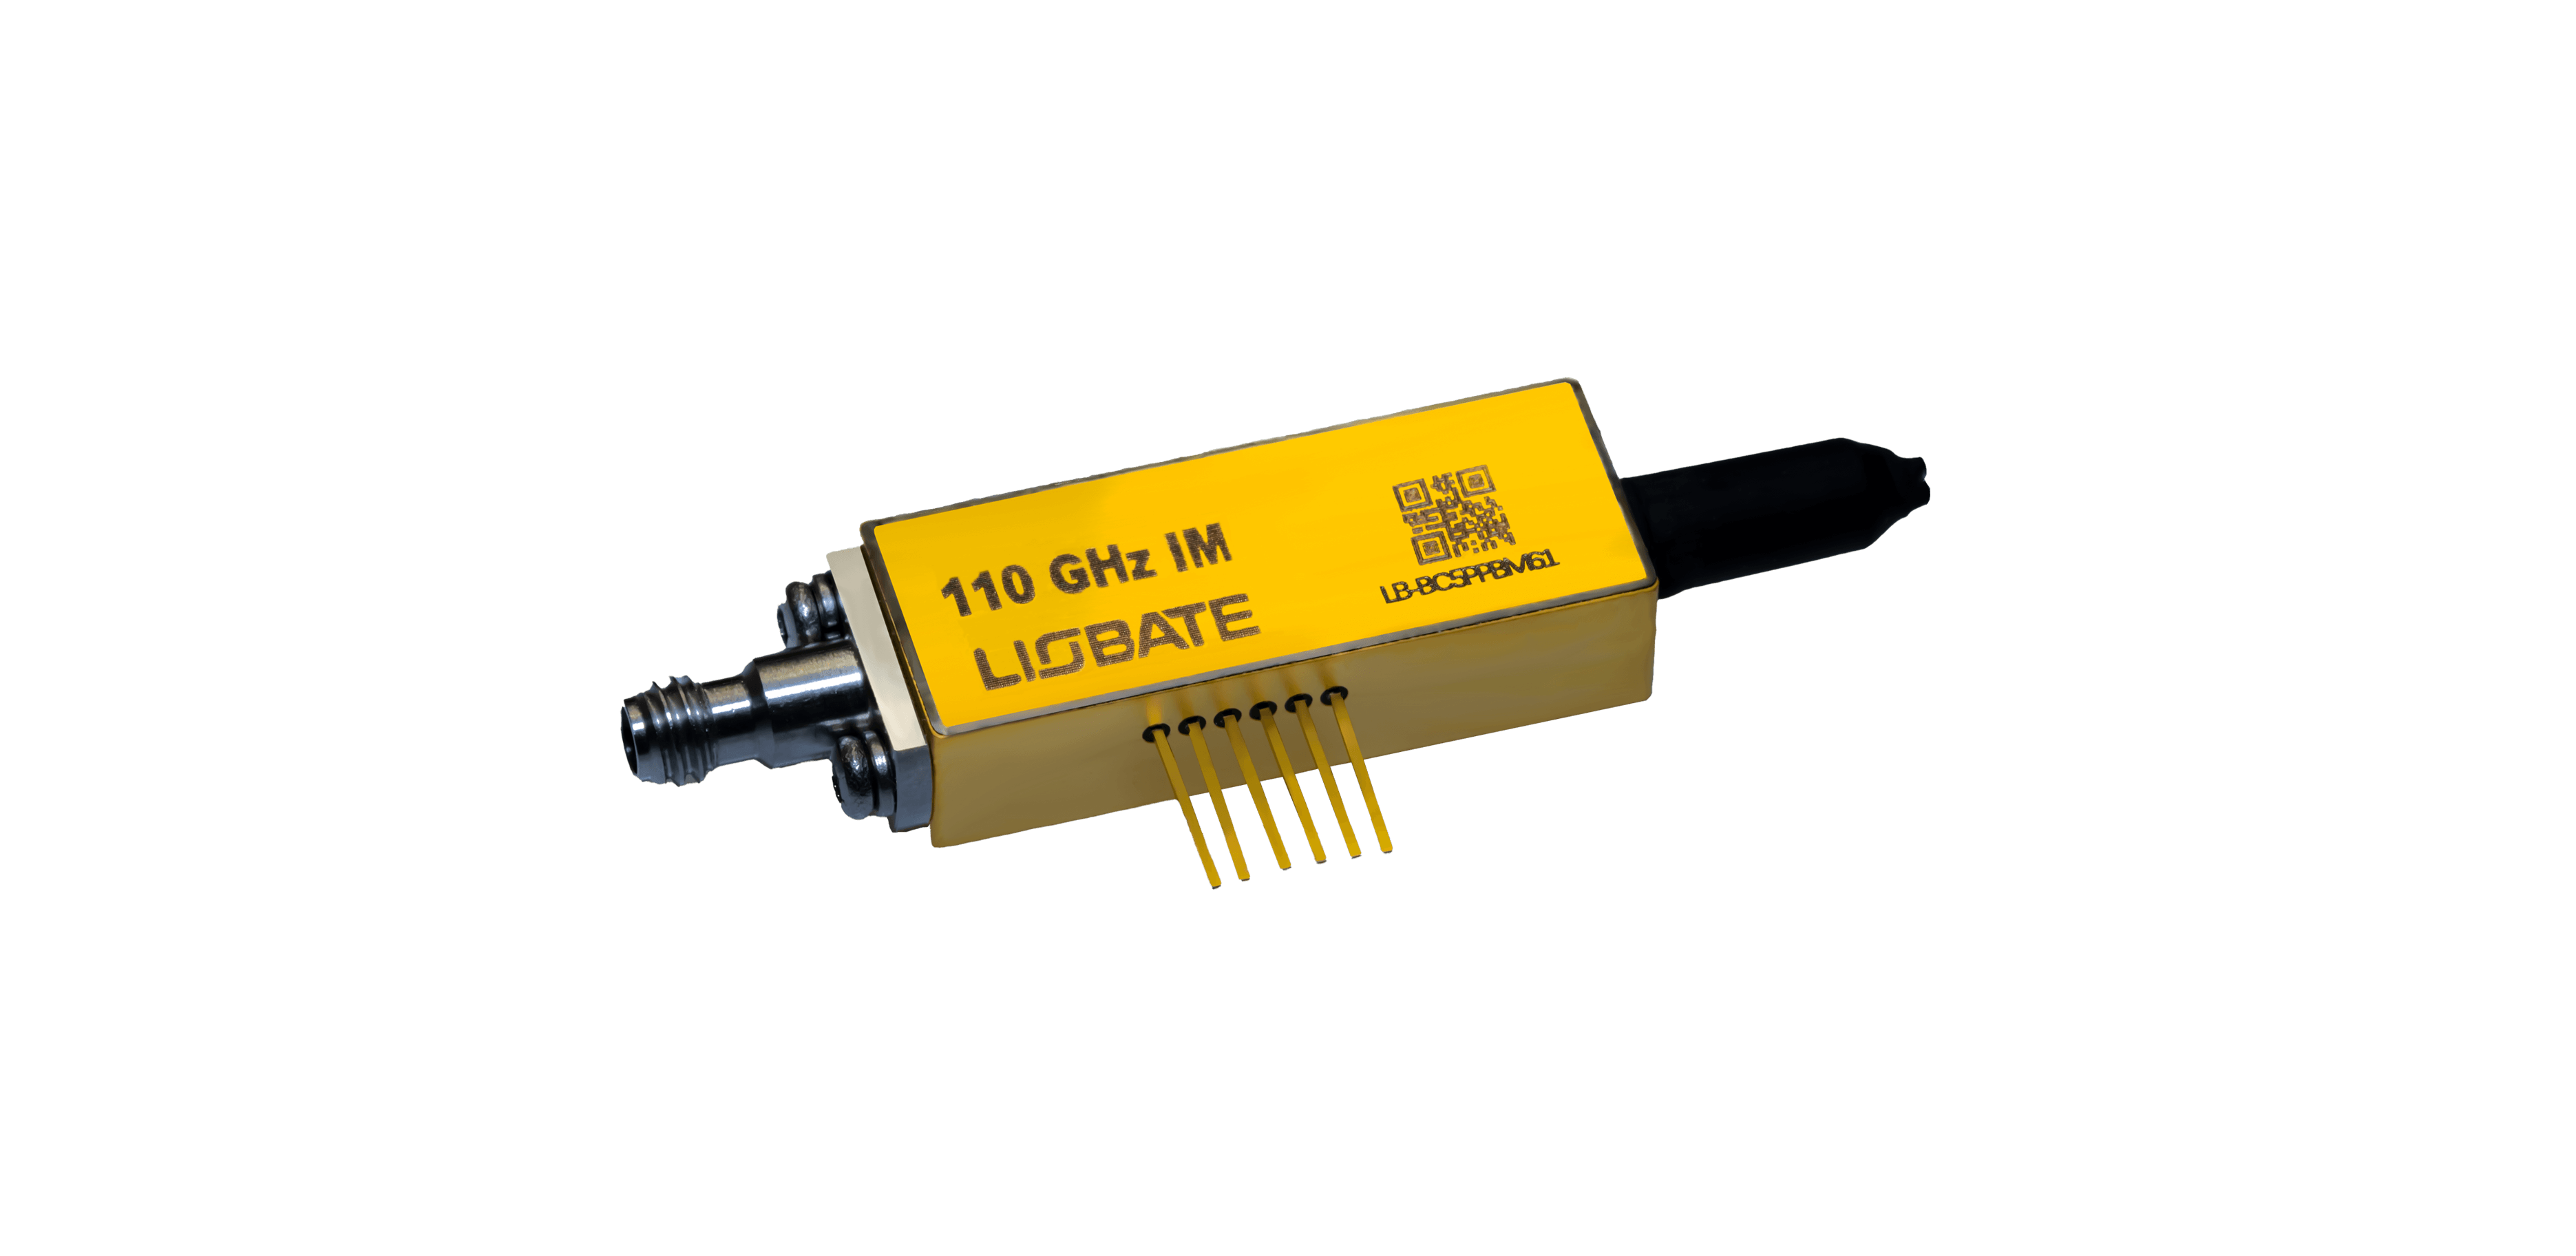
Published TFLN Devices include compact 20/40 GHz and higher-speed 67/110 GHz intensity products, both listed with half-wave voltage below 3 V and insertion loss below 4.5 dB. An integrated-light-source version is also published. These options support several architectures, but each must be matched to the operating wavelength, signal format, package, and lifecycle expectations.
Power Control Links Electrical Commands to Fiber Transmission
The device often uses a Mach-Zehnder interferometer. Light is divided into two paths, an electrical field changes their relative phase, and recombination converts that phase difference into transmitted-power variation. By selecting the bias point and drive swing, they can produce on-off data, linear analog modulation, or controlled pulse shapes for measurement and sensing.
Efficient high-speed electro-optic interaction allows TFLN devices to provide strong modulation in a relatively compact package. The listed 67/110 GHz product addresses demanding waveform rates, whereas a compact 40 GHz version may suit applications that value size and adequate, rather than maximum, bandwidth.
They compare usable response with the actual electrical spectrum so that bandwidth is purchased for a defined need. Optical contrast is not determined by the intensity modulator alone.
Bias accuracy, polarization alignment, laser coherence, connector reflections, and drive symmetry influence the observed extinction. They allocate tolerances across these elements and include control margin. This approach is more traceable than assigning a large extinction target to the device while leaving the surrounding conditions unspecified.
Application Context Changes the Meaning of Each Specification
Data transmission emphasizes error performance, energy, and optical budget. In a short-reach link, a lower drive requirement may simplify electronics, while reduced insertion loss preserves receiver power. The 20/40 GHz and 67/110 GHz options share published limits below 3 V and 4.5 dB, yet their package, response, and cost should be tested against the intended symbol rate.
Laboratory and production test systems may prioritize repeatable analog response. An intensity modulator used for calibration needs known transfer characteristics, low drift, and convenient bias control.
When evaluating TFLN devices for this role, they examine linearity over the required swing, harmonic distortion, optical-power handling, and whether the supplied documentation supports traceable measurement procedures. An integrated low-relative-intensity-noise source changes the subsystem boundary.
The published 40 GHz version provides 12 dBm on-state optical output, potentially reducing separate laser alignment and sourcing tasks. They assess whether source wavelength, noise, serviceability, and thermal behavior fit the instrument. Integration is useful when it removes risk, not merely when it reduces component count.
Stable Operation Requires Bias, Packaging, and Test Discipline
Bias control is central to long-term stability. Temperature, charge effects, and optical power can shift the transfer curve, so a fixed voltage established during assembly may not remain appropriate. They choose manual, periodic, or closed-loop control according to allowed drift and operating time.
Diagnostic access should make bias problems distinguishable from laser or receiver faults. For an intensity modulator, packaging determines RF launch quality, fiber coupling, polarization behavior, and environmental protection. They qualify connectors, pigtails, bends, vibration, temperature cycling, and rated optical and electrical stress.
TFLN devices intended for continuous service should be tested in the actual mounting and cable arrangement because mechanical details can influence high-frequency measurements. Production acceptance combines fast screening with deeper sample characterization.
Every unit may receive loss, bias, and response checks, while selected devices undergo detailed linearity and environmental tests. They correlate those results and monitor trends by lot. A stable distribution is often more useful to manufacturing than an outlier unit that cannot be reproduced. Control bandwidth interacts with the bias method.
A slow loop may correct temperature drift while leaving rapid waveform effects untouched, whereas aggressive control can add dither or noise inside the measurement band. They separate these timescales and confirm that the control strategy does not disturb the signal being generated. Controlled optical power is a foundational function, but the appropriate implementation changes with the system.
They select bandwidth, voltage, loss, source integration, and control method together. This prevents a communication device from being applied blindly to a precision instrument, or a laboratory component from entering volume production without the necessary stability and traceability.
A useful supplier discussion begins with waveforms, reference planes, environmental conditions, and acceptance data. Prototype testing should include the planned laser, driver, fibers, receiver, and bias method. The results can then be converted into purchasing specifications that protect performance without imposing limits that are expensive to test and irrelevant to operation.
Transfer curves, bandwidth, loss, and bias behavior describe different parts of the intensity-modulator operating window. Comparing Liobate packages under common drivers and environmental conditions gives buyers a coherent view of that window across units and lots.